For builders
Your first error-analysis session
Take a random sample from your logs, read each trace with the person who owns quality, name the failure categories, count them and export a taxonomy.
In brief
4 POINTS- A complaint sheet names failure types but supports no rate, because it holds only the conversations someone chose to flag.
- A random sample of 100 traces gives a 95% or better chance of seeing, at least once, a failure that appears on 3% or more of traffic.
- Write one code per failing trace, at the first step that went wrong; later steps inherit it, so counting them counts one fault many times.
- Stop when new categories have stopped appearing and the interval on the failure share is narrow enough for the decision at hand.
On this page (8)
You have logs, a complaint sheet or a file of traces from production. Without a random sample, the loudest complaint sets the fix list, and nobody can say how often it happens. This session turns your logs into a counted list of failure categories you can act on, built from your own outputs. The method rests on research into where the decisive error lands in a failed agent trajectory and how far downstream the signal travels and on why named failure codes beat free-text reflection.
Run the session.
- Open the error-analysis workbench with your file or the example. Keep the review order random, record the seed and review the first 100 traces (all of them on a smaller file).
- Read with the person who owns quality. Give each trace one verdict: pass, fail or unsure. Write one short code per failure, at the first step that went wrong.
- Merge similar codes into a short list of categories and count them.
- Stop when new categories stop appearing and the interval is narrow enough for your decision. Export the taxonomy.
- Take the categories to the criteria and rubric builder.
A complaint sheet names the suspects
A complaint or feedback sheet holds only the conversations someone chose to flag. The denominator is missing and the sample is self-selected, so the numbers support no rate. The sheet is still useful: it names the failure types worth looking for. Read it first, then draw a random sample from the full logs to count them. The thumbs-down rate page bounds a rate from ratings when most conversations go unrated.
Take a random sample and record the seed
The sample size decides how rare a failure you are likely to see at all. The chance of seeing at least once a failure that appears on p of traffic in a random sample of n traces is 1 minus (1 minus p) to the power n. At 100 traces the chance is 95.2% for a failure on 3% of traffic and 63.4% for 1%. At 40 traces it is 87.1% for 5% and 55.4% for 2%. We draw 100 random traces as a default because it gives better than a 95% chance of surfacing a failure on 3% or more of traffic. Record the seed so that you can reproduce the draw. For a file over 10 MB or 200,000 rows, the review sample drawer pulls the sample first.
Read together, one verdict per trace
The person who owns quality and the person who knows the system read each trace together. Each trace gets one verdict: pass, fail or unsure. The pair catches failures the quality owner would miss for lack of system knowledge and failures the person who knows the system would miss for lack of product context. An unsure trace stays unsure until the pair agrees.
Note the first step that went wrong
On each failing trace, write one short code at the earliest step that went wrong. Later steps follow from that step, so counting later steps counts one fault many times. In a 2026 study of 1,184 failed coding-agent trajectories on Terminal-Bench, the decisive error landed at a median of step 7 of a median 27-step trajectory, and the first observable signal came around step 16. The workbench records the first failing step beside each code.
In trace tr-rd-023 of the returns-desk example, the eligibility check returns "eligible":false at step 6, the agent creates a return label anyway at step 7, then tells the customer a label was emailed at step 9. The code goes on step 7: the first action that should not have happened. Step 9 follows from it.
Group codes into categories and count
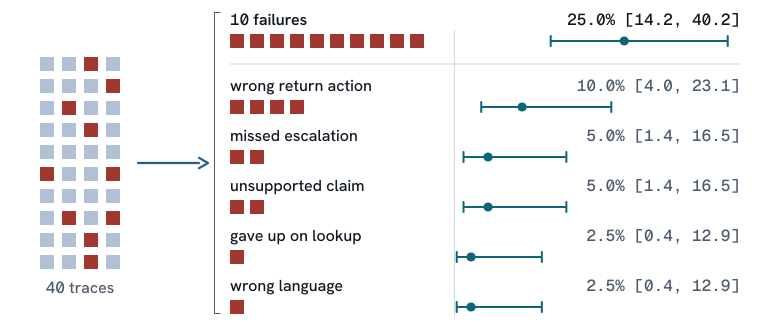
Name each failure in your own first words as a short code, then merge similar codes into a short list of named categories. Qualitative researchers call this open coding; relating each category to its subcategories, a later step, is axial coding1. In the 2026 AdaMAST preprint, the SWE-agent resolution rate on SWE-bench Verified Mini rose from 60% with free-text reflection to 70% with failure codes induced from the agent’s own traces, and the first move, from free text to a fixed set of named codes, supplied eight of those ten points. Vocabularies induced for six domains barely overlapped (mean pairwise Jaccard similarity 0.14), so the categories worth naming differ from one domain to the next. In the returns-desk example, one review of 40 traces found 10 failures, 25.0% [14.2, 40.2] (Wilson score, two-sided, 95%). The ten codes merged into five categories: wrong return action 4 of 40, 10.0% [4.0, 23.1]; missed escalation and unsupported claim 2 of 40 each, 5.0% [1.4, 16.5]; gave up on lookup and wrong language 1 of 40 each, 2.5% [0.4, 12.9].
Read some passes too
Random order puts passes in the queue alongside failures. Read them. A pattern that shows up only in failing traces marks a clean category. One that also shows up in traces you passed means the boundary is blurry, and the criterion you write for it needs examples on both sides2.
Stop when categories stop appearing, and come back after a change
No settled rule says when to stop3. Stop when the interval on the failure share is narrow enough for the decision at hand and new categories have stopped appearing. The workbench shows a saturation window: the count of new categories among the last 20 coded failures. Run the session again after a model change, a prompt change, an incident or a shift in traffic. For a model change, the model-change playbook lists the checks that come with it.
The counted list feeds criteria and test cases
Take the categories to the criteria and rubric builder to turn each one into a grading rule. Map them to test cases with the risk-to-test mapper.
Footnotes
-
Corbin and Strauss, “Grounded theory research: procedures, canons, and evaluative criteria”, Qualitative Sociology 13(1):3-21, 1990, https://doi.org/10.1007/BF00988593 (as of 2026-10-17): describes open coding, which compares incidents in the data and groups similar ones into named categories, and axial coding, which relates categories to their subcategories. ↩
-
Wu et al., “Errudite: Scalable, Reproducible, and Testable Error Analysis”, ACL 2019, pp. 747-763, https://doi.org/10.18653/v1/P19-1073 (as of 2026-10-17): groups should be precisely defined, and analysis should include both positive and negative examples. ↩
-
Braun and Clarke, “To saturate or not to saturate? Questioning data saturation as a useful concept for thematic analysis and sample-size rationales”, Qualitative Research in Sport, Exercise and Health 13(2):201-216, 2021, https://doi.org/10.1080/2159676X.2019.1704846 (as of 2026-10-17): questions data saturation as a rationale for when to stop coding or how large a sample to take. ↩